

Viral SNAP Chart Spreads Racial Misinformation as Federal Shutdown Threatens Food Security for Millions
The History Behind The Headlines
By Darius Spearman (africanelements)
Support African Elements at patreon.com/africanelements and hear recent news in a single playlist. Additionally, you can gain early access to ad-free video content.
A Dangerous Lie Goes Viral at a Critical Moment
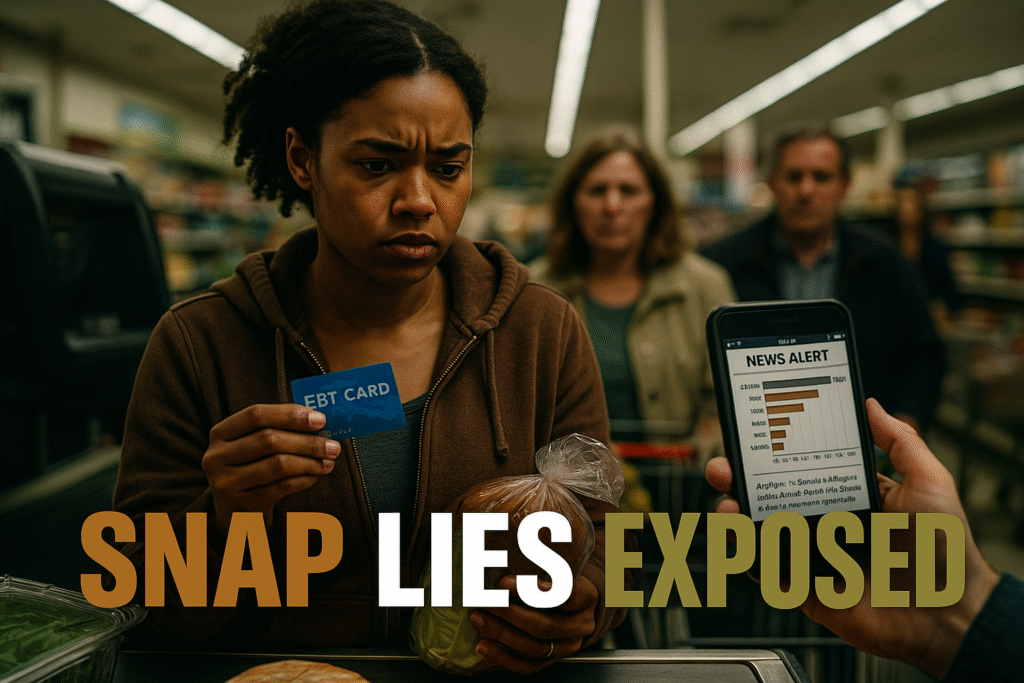
A misleading chart claiming to show the racial and ethnic breakdown of food stamp recipients has spread rapidly across social media platforms, garnering millions of views as the nation faces an unprecedented crisis in food assistance. The chart falsely suggests that most Supplemental Nutrition Assistance Program recipients are non-white immigrants, with Afghan people listed as the largest group at 45.6 percent, followed by Somali recipients at 42.4 percent. White Americans appear near the bottom at just 8.6 percent. The timing could not be worse. Beginning November 1, approximately 42 million Americans risk losing their SNAP benefits due to the federal government shutdown.
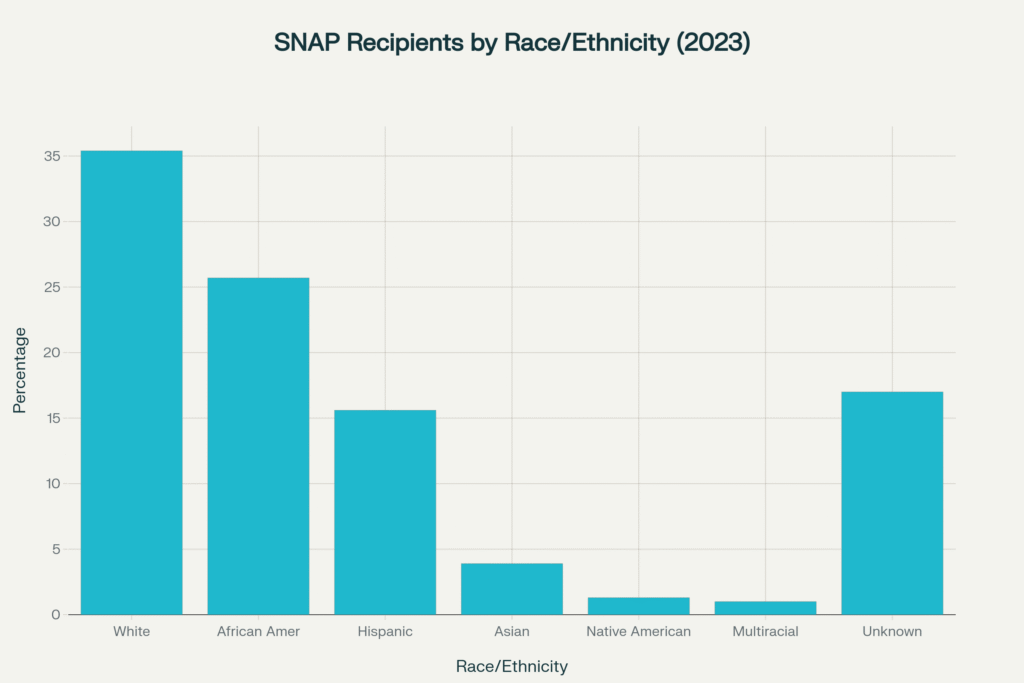
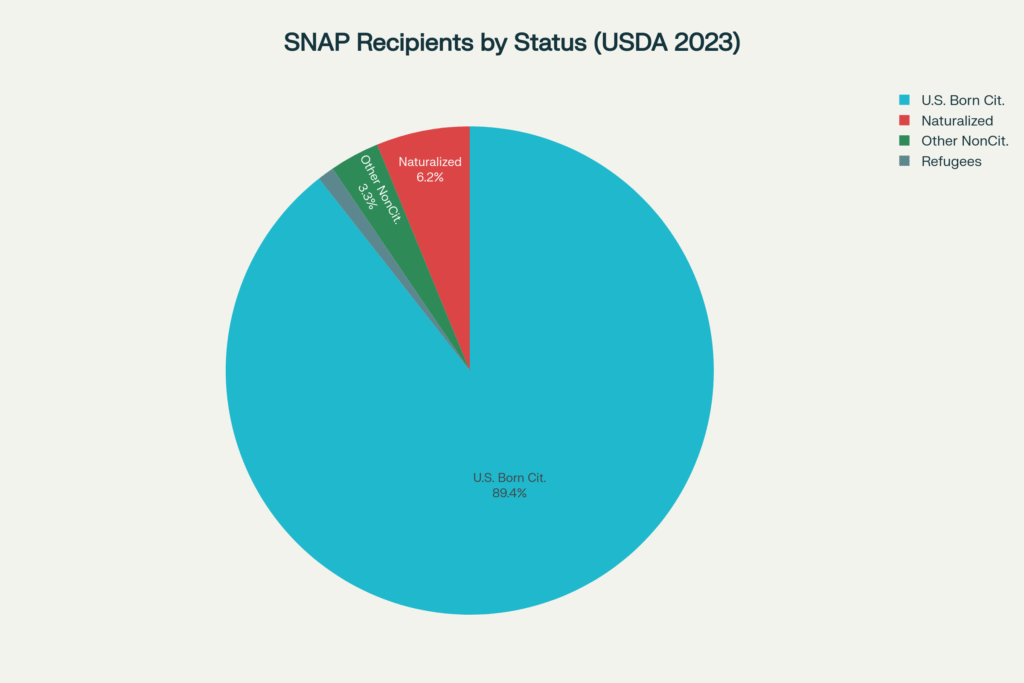
The reality painted by official government data tells a completely different story. According to the most recent United States Department of Agriculture data from 2023, white people constitute the largest racial group receiving SNAP benefits at 35.4 percent. African Americans represent 25.7 percent of recipients, Hispanic people 15.6 percent, and Asian people just 3.9 percent. Even more striking is the citizenship breakdown. The USDA reports that 89.4 percent of SNAP recipients are United States-born citizens. Less than 11 percent of participants are foreign-born, and this includes naturalized citizens, refugees, and other eligible noncitizens.
Actual breakdown of SNAP recipients by race and ethnicity based on official USDA 2023 data, showing White recipients comprise the largest group at 35.4%
The viral chart originated from a June blog post by The Personal Finance Wizards, which cited Census data but cherry-picked specific ethnicities without providing proper context. The site published a disclaimer acknowledging it cannot guarantee the completeness, accuracy, or reliability of its information. The data appears to show the percentage of specific ethnic groups receiving SNAP, not what percentage of total SNAP recipients belong to each group. This distinction is crucial but was lost in the viral spread.
The Government Shutdown Puts Millions at Risk
As misleading information spreads online, a very real crisis looms. The federal government shutdown that began October 1 has now become the second-longest in United States history. The United States Department of Agriculture notified states that SNAP benefits would halt on November 1 if the shutdown continued. This marks the first interruption of benefits since the program began more than six decades ago.
The impact will be devastating. More than 3.5 million low-income Texans are among the 40 million Americans receiving SNAP payments monthly. At least 25 states have announced they will cut off benefits on November 1 without congressional action. The Trump administration has stated it will not use approximately $5 billion in contingency funds to pay out SNAP benefits, despite previous shutdowns utilizing such emergency reserves.
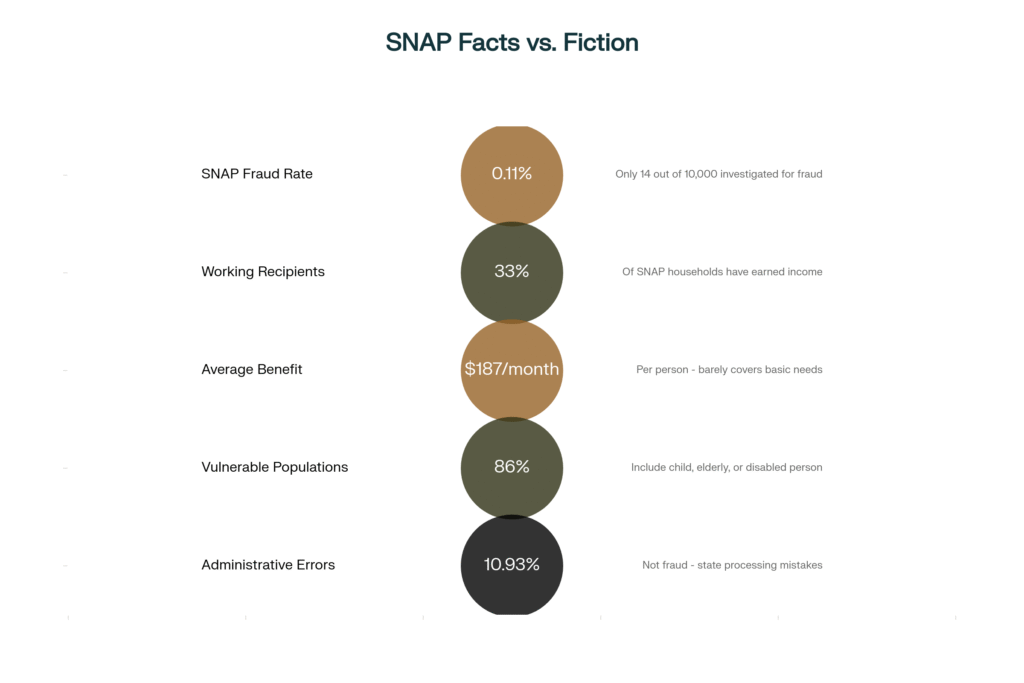
The monthly cost to keep SNAP operating is about $8 billion. Each recipient receives an average of around $200 monthly, or approximately $187 per person. This modest assistance barely covers basic nutritional needs, yet for families living paycheck to paycheck, even a short disruption can have immediate consequences. Food banks are already bracing for overwhelming demand they cannot meet. Nine food banks and anti-hunger groups in eight states told Reuters they will struggle to absorb higher demand if November SNAP benefits are not distributed.
Black Families Face Disproportionate Impact from Benefit Cuts
The convergence of viral misinformation and the looming SNAP shutdown creates a particularly dangerous situation for Black and minority families. While Black people represent only 13 percent of the United States population, they constitute 26 percent of SNAP recipients. This disparity does not reflect laziness or fraud. Instead, it reflects deep roots of racial inequality, including lower wages, fewer job opportunities, housing discrimination, and underfunded schools.
Research demonstrates that SNAP participation reduces race-related disparities in food insecurity. Food insecurity levels are higher among Black households than white households when they are not enrolled in SNAP, but lower among white households for those receiving SNAP benefits. A Johns Hopkins study found that among households not participating in SNAP, Black households had a 52 percent higher risk of food insecurity than white households. However, among SNAP participants, Black households were actually less likely than white households to be food insecure.
The November 1 cutoff will hit Black communities especially hard. Black elders living on fixed incomes with rising medical costs will have to stretch their resources even further. Disabled Black adults who face constant barriers to employment will lose one of the few reliable supports they have. Working parents will face impossible choices between rent and groceries, medicine and fresh produce, light bills and school supplies. In 2023, food insecurity rates were significantly higher for Black households at 23.3 percent and Hispanic households at 21.9 percent, both more than double the rate of white households at 9.9 percent.
The Origins of Food Assistance in America
Understanding the current crisis requires examining the historical foundations of food assistance in America. Modern food stamps originated during the Great Depression when the federal government launched the first Food Stamp Program in May 1939. This initial program ended with the economic prosperity of World War II, but hunger persisted for the poor even after the Great Depression ended.
The issue reemerged during John F. Kennedy’s 1960 presidential campaign when he encountered shocking poverty in West Virginia coal country. As Kennedy’s former speechwriter Ted Sorensen wrote, the candidate and his wife Jackie were shocked by what they witnessed. In 1961, following his victory, Kennedy’s first executive order was to reinstate a national food stamp program similar to that of the Great Depression. Three years later, this pilot program became permanent under President Lyndon B. Johnson through the 1964 Food Stamp Act.
The program grew beyond anyone’s expectations. Congress initially estimated it would serve at maximum 4 million people. By 1970, some 5 million Americans were buying stamps through the initiative, a number that doubled to 10 million by the end of the next year. With support from farmers benefiting from supplying the program and advocacy from poverty groups, in 1977 the requirement to spend money to purchase stamps was eliminated. This meant the poorest of the poor could finally benefit. By 1979, roughly 20 million low-income Americans depended on the program.
Racial Discrimination Built Into the New Deal
While the New Deal laid critical groundwork for future anti-poverty efforts, racial discrimination was present from the start. The 1935 Social Security Act specifically excluded domestic work and agricultural labor, industries that relied heavily on Black men and women, from Social Security eligibility. States had substantial discretion in determining eligibility for welfare through the Aid to Dependent Children program. Southern states sometimes used this flexibility to restrict access to benefits during harvesting seasons, effectively coercing poor Black families into working in the fields at whatever wages were offered.
By 1939, the Aid to Dependent Children caseload was 80 percent white, despite the disproportionate burden of poverty on Black families. Black workers continued to suffer discrimination from whites who administered New Deal agencies. In most federal relief programs, Black workers got lower wages than whites, were employed only as unskilled laborers, and were employed only after whites were.
The Agricultural Adjustment Administration acreage reduction hit Black families particularly hard. Since 40 percent of all Black workers made their living as sharecroppers and tenant farmers, white landlords could make more money by leaving land untilled than by putting land back into production. The Agricultural Adjustment Administration policies forced more than 100,000 Black families off the land in 1933 and 1934 alone. The Federal Housing Authority refused to guarantee mortgages for Black families who tried to buy in white neighborhoods, and the Civilian Conservation Corps maintained segregated camps.
The Birth of the Welfare Queen Myth
The most damaging and persistent stereotype weaponized against public assistance recipients emerged in the 1970s. In 1974, Chicago police investigating a burglary discovered that a woman known as Linda Taylor was perpetrating welfare fraud. Using fake names and forged documents, she had stolen $8,865.67 from Aid to Families with Dependent Children. Because welfare fraud accounted for less than 1 percent of federal welfare expenditures, the Illinois Department of Public Aid initially looked the other way.
Chicago Tribune journalist George Bliss seized on the story, writing a feature about Taylor for the September 29, 1974 edition. The article gawked at her dozens of aliases and addresses, her divorces, and the supposedly lavish lifestyle she lived on the public dime. The story became a sensation, running in more than a thousand newspapers across the country.
Ronald Reagan latched onto this story during his 1976 presidential campaign. At a campaign rally that year, Reagan introduced the welfare queen into public conversation about poverty. He hyperbolically claimed she collected $150,000 in government assistance a year, including welfare benefits and food stamps. The true total was about $40,000, spread over multiple years. Reagan constantly referred to the welfare queen at his campaign rallies in 1976 and again in 1980.
Though Linda Taylor was no more typical of Americans on welfare than Bernie Madoff was typical of investment bankers, the archetype was powerful enough to help propel Reagan to the White House. As criminal as Taylor may have been, historian Rick Perlstein noted the welfare queen was symbolically terrifying. These women were understood to be overwhelmingly women of color in an effort to push racialized narratives. They were portrayed as social parasites, engaging in self-damaging behavior while draining society of valuable resources.
The Reality Behind the Welfare Queen Myth
The welfare queen stereotype bears no resemblance to the reality of SNAP recipients. Current data reveals that 86 percent of all SNAP benefits go to households that include a child, elderly person, or person with disabilities. About 92 percent of all SNAP benefits go to households with income at or below the federal poverty line. Almost one-third of SNAP households have earned income, though only 20 percent of households have gross monthly income above the federal poverty line.
The myth of rampant fraud could not be further from the truth. According to a 2018 Congressional Research Service report, for every 10,000 households participating in SNAP, about 14 contained a recipient who was investigated and determined to have committed fraud. Within SNAP, for every $10,000 paid in benefits, about $11 is determined by state agencies to have been overpaid due to recipient fraud. To put this in perspective, the Internal Revenue Service estimates that for every $6 owed in federal taxes, $1 is not paid because of tax evasion or fraud.
The vast majority of SNAP households do not receive cash welfare benefits. Only 4 percent of all SNAP households, and only 10 percent of SNAP households with children, receive benefits through the Temporary Assistance for Needy Families program. More than two-thirds of SNAP participants at a point in time are not expected to work, primarily because they are children, older adults, or people with disabilities.
How Work Requirements Hurt Rather Than Help
Despite evidence that work requirements do not increase employment outcomes, policymakers have repeatedly imposed them on SNAP recipients. Research shows that mandatory work requirements do not increase employment outcomes, but receipt of SNAP does. Therefore, taking away food assistance from Americans struggling to get employment is not based in strengthening work, but is rooted in racial discrimination to justify program cuts.
A 2019 Trump administration rule restricted states’ ability to waive the SNAP three-month time limit in areas with insufficient jobs. Research analyzing the effects of work requirements from 2013 to 2017 found they led about 600,000 adults to lose SNAP benefits, more than one-third of all able-bodied adults without dependents. The caseload reductions occurred quickly, within a few months of implementation. By reducing SNAP benefits by $2.5 billion in 2017 alone, work requirements could actually lower employment rather than boosting it.
Research by Simon Haeder and Donald Moynihan demonstrates how racial resentments affect public attitudes toward administrative policies in SNAP. Those who have more resentment toward Black or Latino people tend to favor harsher administrative policies that can result in restricting benefits. Although such policies do not mention race or ethnicity, they can fall with particular severity on minority populations and thus increase racial disparities.
The Looming Crisis for Food Banks and Local Communities
Food banks across the nation were already experiencing significant strain before the government shutdown. Increasing food costs had led to a rising influx of individuals seeking assistance, while reductions in federal programs had diminished their available resources. More than 50 million people received food from food banks, pantries, and other charitable sources in 2023, compared to roughly 40 million in 2019.
The charitable food system and food banks do not have the resources to replace the $8 billion in monthly SNAP dollars. John Sayles, chief executive officer of Vermont Foodbank, stated there is no safety net after SNAP other than the food shelf. Katy Anderson, vice president of strategy at Albuquerque’s Roadrunner Food Bank, reported seeing panic among residents due to the SNAP halt.
The impact extends beyond just those receiving benefits. Each $1 in SNAP benefits provides an economic benefit of $1.60 through the multiplier effect in which dollars flowing through the local economy help support spending, jobs, and growth. SNAP is the foundation of economic support for many food retailers, particularly smaller places in rural areas and corner stores in cities. The consequences reach far beyond just the people who receive SNAP.
Why This Matters Today
The convergence of viral misinformation and a real-world crisis reveals how deeply entrenched racial stereotypes continue to shape policy and public opinion. The false narrative that immigrants and minorities are draining the welfare system persists despite overwhelming evidence to the contrary. Meanwhile, actual policies threaten to plunge millions of vulnerable Americans, disproportionately Black and brown families, into food insecurity.
The history of food assistance in America has always been intertwined with racial discrimination. From the New Deal’s systematic exclusion of Black workers to Reagan’s weaponization of the welfare queen stereotype, policies ostensibly designed to help the poor have often been twisted to punish those deemed undeserving based on race. The current shutdown and the viral spread of misinformation represent the latest chapter in this troubling history.
As 42 million Americans face the prospect of losing food assistance, understanding this historical context becomes critical. The fight is not just about restoring SNAP benefits for November. It is about confronting the racist narratives that have shaped public assistance programs since their inception. It is about recognizing that when we allow stereotypes to drive policy, the most vulnerable among us pay the price. For Black families already struggling with systemic inequality in wages, employment, housing, and education, the loss of SNAP represents more than a temporary setback. It is an attack on survival itself.
The question facing the nation is whether we will allow false narratives to continue driving policy, or whether we will finally reckon with the history behind the headlines and build a system that truly serves all Americans in need.
ABOUT THE AUTHOR
Darius Spearman has been a professor of Black Studies at San Diego City College since 2007. He is the author of several books, including Between The Color Lines: A History of African Americans on the California Frontier Through 1890. You can visit Darius online at africanelements.org.